
Rill
CLIOpen-source, agent-friendly BI: define metrics and dashboards in YAML and SQL, and rill init generates project instructions and MCP config for Claude Code so agents can build business dashboards and answer questions in natural language. Local use is free; publishing to Rill Cloud needs an account.

Agent-first, human-friendly business intelligence






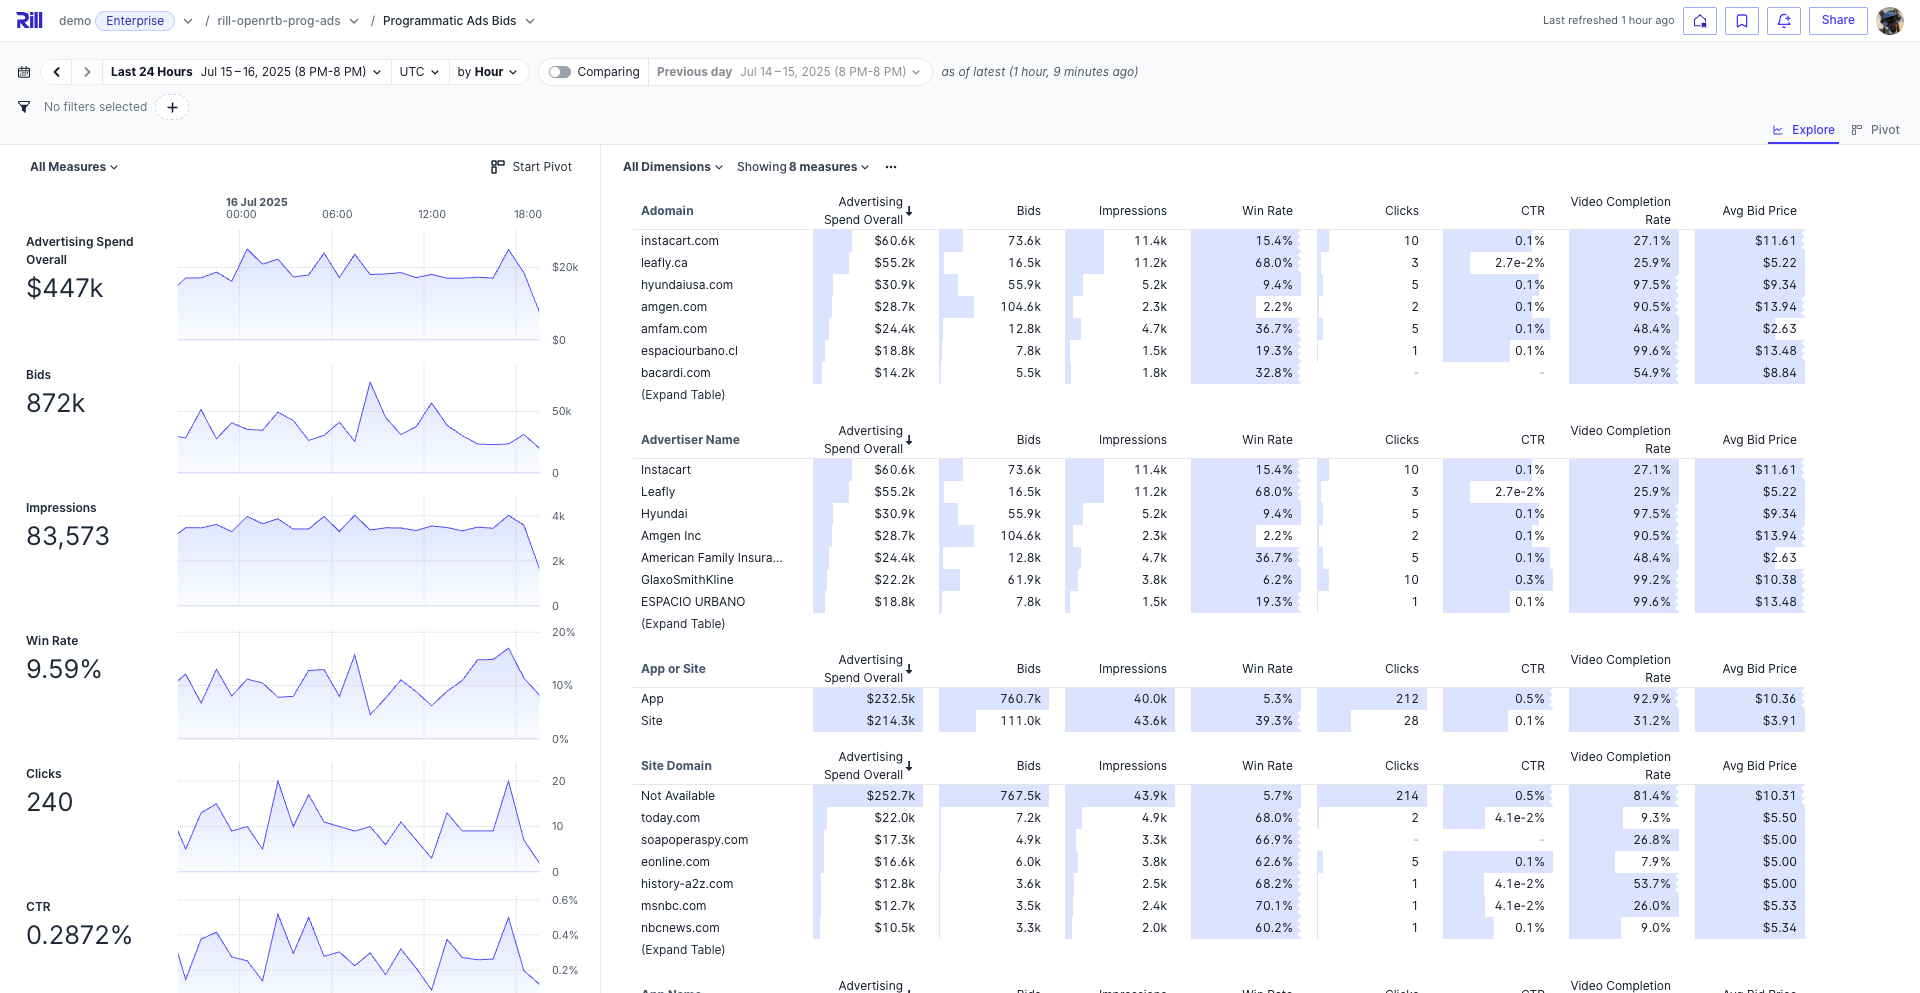
Rill is the fastest BI tool for humans and agents, powered by OLAP engines like ClickHouse and DuckDB.
Get Started
curl https://rill.sh | sh        # install
rill start my-project            # create a project and open the UI
Scaffold a project with agent context
Use rill init to scaffold a project interactively:
➜ rill init
? Project name my-rill-project
? OLAP engine duckdb
? Agent instructions claude

Created a new Rill project at ~/my-rill-project
Added Claude instructions in .claude and .mcp.json

Success! Run the following command to start the project:

  rill start my-rill-project
Why Rill?
- Build with agents — BI-as-code (YAML + SQL) means coding agents like Claude Code and Cursor can author projects, dashboards, and security policies end-to-end
- Semantic layer — Single source of truth for dimensions, measures, and time grains — defined in YAML, generating SQL at query time against your OLAP engine
- Explore with agents — Conversational BI lets business users query metrics in natural language; the MCP server connects AI agents directly to your semantic layer
- Real-time performance — Sub-second queries at any scale; ClickHouse for billions of rows, DuckDB for smaller datasets and fast iteration
- Embeddable — Dashboards, APIs, and agent interfaces you can ship in your product
Capabilities
Rill Developer (local)
- Connectors — S3, GCS, databases, and 20+ sources
- OLAP Engines — Managed ClickHouse or DuckDB included, or connect an external engine (ClickHouse Cloud, Druid, Pinot, MotherDuck)
- SQL Models — Transform raw data with SQL, join models together
- Data Profiling — Instant column stats and distributions
- Incremental Ingestion — Load only new data on each run to keep large datasets current without full refreshes
- Semantic Layer — Dimensions, measures, and time grains in YAML
- Row Access Policies — Per-user, per-group data access control
- Local Dashboards — Preview and explore dashboards locally
Rill Cloud
- Deploy — Git-backed, versioned deployments — push with
rill deployor connect a repo for automatic CI/CD - Explore & Canvas Dashboards — Interactive dashboards, embeddable in your product
- Conversational BI — Ask questions in natural language
- MCP Server — Connect Claude, ChatGPT, or any AI agent to your metrics
- Custom APIs & Embedding — Expose metrics via REST or embed dashboards
- Alerts & Reports — Threshold alerting, code-defined or UI-defined
How It Works
Define everything in code — models, metrics, dashboards — and Rill handles the rest.
1. Connect data — models/events.yaml
type: model
connector: duckdb
materialize: true

sql: |
  select * from read_parquet('gs://rilldata-public/auction_data.parquet')
2. Define metrics — metrics/events_metrics.yaml
version: 1
type: metrics_view
model: events
timeseries: timestamp

dimensions:
  - name: country
    column: country
  - name: device
    column: device_type

measures:
  - name: total_events
    expression: count(*)
  - name: revenue
    expression: sum(price * quantity)
    description: Total revenue
3. Create a dashboard — dashboards/events_explore.yaml
type: explore

display_name: "Events Dashboard"
metrics_view: events_metrics

dimensions: "*"
measures: "*"
4. Deploy
rill deploy # push to Rill Cloud
Your metrics view is immediately queryable on Rill Cloud — add YAML files to configure dashboards, alerts, and custom APIs.
Learn More
Getting Started with Rill Developer • Exploring Data with Rill • Data Talks on the Rocks • Agentic Analytics with Claude Code and Rill
Examples
| Example | Description | Links |
|---|---|---|
| Programmatic Ads | Bidstream data for pricing and campaign performance | GitHub · Demo |
| Cost Monitoring | Cloud infra merged with customer data | GitHub · Demo |
| GitHub Analytics | Contributor activity and commit patterns | GitHub · Demo |
Or explore a live embedded dashboard.
Community



Contributing
We welcome contributions! See our Contributing Guide to get started.
Ähnliche Ressourcen

Business Analytics
PluginBusiness analytics plugin from the wshobson/agents marketplace: KPI dashboard design and data storytelling skills plus a business analyst subagent to choose metrics, plan dashboard layouts and turn data into reports executives or investors understand. Methods and templates only; no data connections.
wshobson/agents40.9k
Data Analytics
SkillOpenAI's official data analytics skills: data quality assessment, KPI design, metric anomaly diagnosis, dashboards and analysis reports, market sizing and notebooks. Ships with a Codex plugin; some skills depend on its runtime.
openai/plugins7.5k
Data
PluginData analysis plugin: writes queries in each SQL dialect, explores datasets, runs statistical tests, charts with Python and builds interactive HTML dashboards, then reviews methods and conclusions before sharing. Connects to Snowflake, BigQuery and other warehouses. Official from Anthropic.
anthropics/knowledge-work-plugins29.9kData Analytics
PluginOpenAI's official Codex plugin for answering product and business questions with data: metric anomaly diagnosis, KPI design, market sizing, dashboards and reports, notebooks and data quality checks. Connects to data warehouses and BI tools.
openai/plugins7.5k
Amplitude
PluginAmplitude's official plugin with a remote MCP and nearly 30 analysis skills: build charts and dashboards in plain language, interpret A/B experiments, summarize user feedback, and generate daily or weekly data briefs. Needs an Amplitude account with data (free plan exists); browser sign-in.
amplitude/mcp-marketplace45
DuckDB
CLIIn-process analytical SQL database. Its CLI queries CSV, Parquet and JSON files directly with SQL, no import or server needed, so agents can sample and aggregate large files. Officially maintained.
duckdb/duckdb42.2k