
YouPlot
CLIDraws bar charts, histograms, line charts, scatter plots and box plots in the terminal from CSV/TSV on stdin, so you can glance at data distributions at the end of a shell pipeline. The command is uplot.




Installation
brew install youplot
gem install youplot
nix shell nixpkgs#youplot
guix install youplot
conda install -c conda-forge ruby
conda install -c conda-forge compilers
gem install youplot
:crystal_ball: YouPlot2 - Experimental project with pre-built binaries
Quick Start



uplot <command> [options] <data.tsv>
barplot
curl -sL https://git.io/ISLANDScsv \
| sort -nk2 -t, \
| tail -n15 \
| uplot bar -d, -t "Areas of the World's Major Landmasses"
For offline users: sorts files in a directory by size and shows a bar graph.
ls -l | awk '{print $9, $5}' | sort -nk 2 | uplot bar -d ' '
histogram
echo -e "from numpy import random;" \
        "n = random.randn(10000);"  \
        "print('\\\n'.join(str(i) for i in n))" \
| python3 \
| uplot hist --nbins 20
lineplot
curl -sL https://git.io/AirPassengers \
| cut -f2,3 -d, \
| uplot line -d, -w 50 -h 15 -t AirPassengers --xlim 1950,1960 --ylim 0,600

For offline users: calculates sin values from 0 to 2*pi and plots a sine wave.
python3 - <<'PY' | uplot line
from math import sin, pi

for i in range(101):
    print(f"{i*pi/50}\t{sin(i*pi/50)}")
PY
scatter
curl -sL https://git.io/IRIStsv \
| cut -f1-4 \
| uplot scatter -H -t IRIS
For offline users:
cat test/fixtures/iris.csv | cut -f1-4 -d, | uplot scatter -H -d, -t IRIS
density
curl -sL https://git.io/IRIStsv \
| cut -f1-4 \
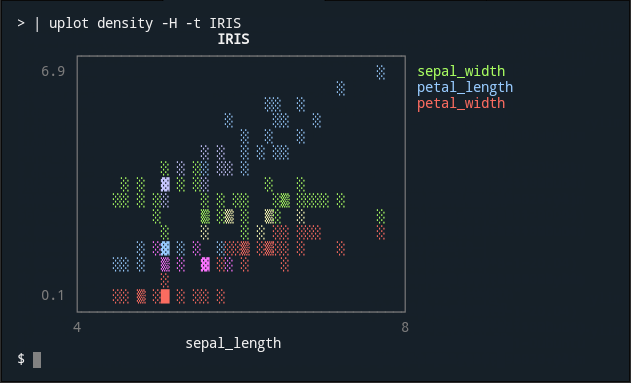
| uplot density -H -t IRIS
For offline users:
cat test/fixtures/iris.csv | cut -f1-4 -d, | uplot density -H -d, -t IRIS
boxplot
curl -sL https://git.io/IRIStsv \
| cut -f1-4 \
| uplot boxplot -H -t IRIS
For offline users:
cat test/fixtures/iris.csv | cut -f1-4 -d, | uplot boxplot -H -d, -t IRIS
count
Count processes by user ID.
ps aux | awk '{print $1}' | uplot count
Count the number of chromosomes where genes are located.
cat gencode.v35.annotation.gff3 \
| grep -v '#' | grep 'gene' | cut -f1 \
| uplot count -t "The number of human gene annotations per chromosome"  -c blue

Note: count is not very fast because it runs in a Ruby script.
This is fine in most cases, as long as the data size is small. If you want to visualize huge data, it is faster to use a combination of common Unix commands as shown below.
cat gencode.v35.annotation.gff3 | grep -v '#' | grep 'gene' | cut -f1 \
| sort | uniq -c | sort -nrk1 \
| uplot bar --fmt yx -d ' ' -t "The number of human gene annotations per chromosome"  -c blue
Usage
Commands
uplot is the shortened form of youplot. You can use either.
| Command | Description |
|---|---|
cat data.tsv | uplot <command> [options] | Take input from stdin |
uplot <command> [options] data.tsv ... | Take input from files |
pipeline1 | uplot <command> -O | pipeline2 | Outputs data from stdin to stdout |
Subcommands
The following sub-commands are available.
| command | short | how it works |
|---|---|---|
| barplot | bar | draw a horizontal barplot |
| histogram | hist | draw a horizontal histogram |
| lineplot | line | draw a line chart |
| lineplots | lines | draw a line chart with multiple series |
| scatter | s | draw a scatter plot |
| density | d | draw a density plot |
| boxplot | box | draw a horizontal boxplot |
| count | c | draw a barplot based on the number of occurrences (slow) |
| colors | color | show the list of available colors |
Output the plot
-o- By default, the plot is output to standard error output.
- If you want to output to standard output, Use hyphen
-o -or no argumentuplot s -o |.
Output the input data
-O- By default, the input data is not shown anywhere.
- If you want to pass the input data directly to the standard output, Use hyphen
-O -or no argumentuplot s -O |. - This is useful when passing data to a subsequent pipeline.
Header
-H- If input data contains a header line, you need to specify the
-Hoption.
- If input data contains a header line, you need to specify the
Delimiter
-d- You do not need to use
-doption for tab-delimited text since the default value is tab. - To specify a blank space, you can use
uplot bar -d ' ' data.txt.
- You do not need to use
Real-time data
-p--progress- Experimental progressive mode is currently under development.
ruby -e 'loop{puts rand(100)}' | uplot line --progress
Show detailed options for subcommands
--help- The
--helpoption will show more detailed options for each subcommand. uplot hist --help
- The
Set columns as x-axis or y-axis
-
YouPlot treats the first column as the X axis and the second column as the Y axis. When working with multiple series, the first column is the X axis, the second column is series Y1, the third column is series Y2, and so on.
-
If you pass only one column of data for
lineandbar, YouPlot will automatically use a sequential number starting from 1 as the X-axis. -
--fmt--fmt xyy--fmt xyxy--fmt yxoptions give you a few more choices. Seeyouplot <command> --helpfor more details.- The fmt option may be renamed in the future.
- The
-xand-yoptions might be used to specify columns in the future.
-
Use
awk '{print $2, $1}'to swap columns. Usepasteto concatenate series.
Categorical data
- With GNU datamash, you can manage to handle categorized data.
cat test/fixtures/iris.csv | sed '/^$/d' | datamash --header-in --output-delimiter=: -t, -g5 collapse 3,4 | cut -f2-3 -d: | sed 's/:/\n/g' | uplot s -d, -T --fmt xyxy- This is not so easy...
Time series
- Not yet supported.
YouPlot Configuration (youplotrc)
You can specify default options in a configuration file in YAML format. For more information, enter the following command.
uplot --config
Tools that are useful to use with YouPlot
Contributing
YouPlot is a library under development, so even small improvements like typofix are welcome! Please feel free to send us your pull requests.
- Report bugs
- Fix bugs and submit pull requests
- Write, clarify, or fix documentation
- English corrections by native speakers are welcome.
- Suggest or add new features
- Make a donation
Development
Fork the main repository by clicking the Fork button.
git clone https://github.com/your_name/YouPlot
bundle install
bundle exec rake test
bundle exec rake install
bundle exec exe/uplot
Do you need commit rights to my repository?
Do you want to get admin rights and take over the project?
If so, please feel free to contact us.
Acknowledgements
- sampo grafiikka - Project logo creation
- yutaas - English proofreading
License
Related resources

Datasette
CLIPublishes SQLite databases as browsable, queryable web pages and JSON APIs, with SQL queries, metadata and plugins, and deploys to Cloud Run and other platforms with datasette publish. Great for data exploration and data journalism. Needs Python 3.10+.
simonw/datasette11.5k
VisiData
CLITerminal tool for exploring and wrangling tabular data: opens dozens of formats including CSV, JSON, Excel and SQLite for filtering, sorting, pivots and frequency counts. --batch mode replays actions headlessly or converts file formats.
saulpw/visidata9.3k
Nushell
CLICross-platform shell built around structured data: pipelines pass tables instead of plain text, and you can open and query JSON, CSV, TOML and more directly. Default builds include nu --mcp, which serves it to agents as an MCP server.
nushell/nushell40.7k
Rill
CLIOpen-source, agent-friendly BI: define metrics and dashboards in YAML and SQL, and rill init generates project instructions and MCP config for Claude Code so agents can build business dashboards and answer questions in natural language. Local use is free; publishing to Rill Cloud needs an account.
rilldata/rill2.9k
Data
PluginData analysis plugin: writes queries in each SQL dialect, explores datasets, runs statistical tests, charts with Python and builds interactive HTML dashboards, then reviews methods and conclusions before sharing. Connects to Snowflake, BigQuery and other warehouses. Official from Anthropic.
anthropics/knowledge-work-plugins29.9k
csvkit
CLIVeteran suite of CSV command-line tools: in2csv converts Excel and JSON to CSV, csvcut, csvgrep and csvsort filter and sort, csvstat computes statistics, and csvsql runs SQL directly against CSV files.
wireservice/csvkit6.4k